Write a note on capability curve of synchronous generator

Capability Curve of Synchronous Generator defines the bounds within which it can operate safely. Various bounds imposed on the machine are:

  1. MVA-loading cannot exceed the generator rating. This limit is imposed by the stator heating.
  2. MW-loading cannot exceed the turbine rating which is given by MVA (rat­ing) x pf (rating).
  3. The generator must operate a safe margin away from the steady-state stability limit (δ = 90°). This can be laid down as a maximum allowable value of δ
  4. The maximum field current cannot exceed a specified value imposed by rotor

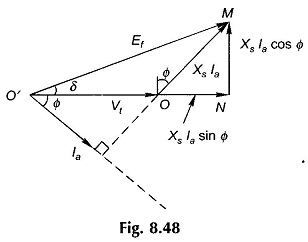
To draw the capability curve of the synchronous generator, its phasor diagram is used which is redrawn in Fig. 8.48; armature resistance is neglected. After multiplying voltage magnitude of each voltage phasor by (3Vt/Xs), the phasor diagram is redrawn in Fig. 8.49. It is immediately recognized that OMN is the complex power triangle (in 3-phase values) wherein

Capability Curve of Synchronous Generator

Capability Curve of Synchronous Generator

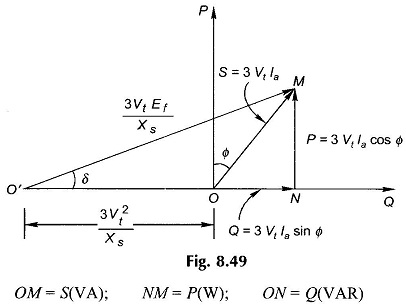
Obviously Q is positive for lagging power factor, Φ being the angle of OM from the P-axis. A mere scale change will convert these values to the units of MVA, MW and MVAR.

Constant S operation will lie on a circle centred at O and radius OM. Constant P operation will lie on a line parallel to QO′-axis. Constant-excitation (Ff) operation will lie on a circle centred at O′ of radius OM(3VtEf/Xs). Constant-pf operation will lie on a radial line through O.

Now with specified upper limits of S, P and Ef (field current), the boundaries of the capability curve can be drawn as in Fig. 8.50. The limit on the left side is specified by δ (max), the safe operating value from the point of view of transient stability.

Capability Curve of Synchronous Generator

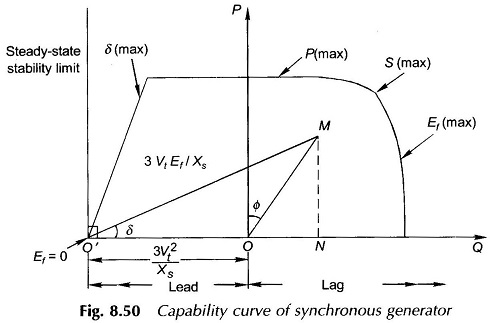
Since the minimum excitation operation corresponds to δ = 90°, the machine operation is at a safe limit from Ef (min) by specifying δ (max).

The capability curve of the synchronous motor can be similarly drawn and will lie in the lower half of the PQ-plane and “lag” and “lead” regions will interchange.

Related posts:

  1. Limitations for Loading Capability of Transmission System
  2. BH Curve Relationship of Ferromagnetic Material
  3. Ideal Voltage Transfer Curve of Op Amp
  4. What is Load Curve?
  5. Load Curve in Power Plant
  6. Selection of Power Generation Unit in Load Curve
  7. Polar Curve in illumination | Rousseau’s Construction
  8. Three Phase Synchronous Generator
  9. Synchronous Generator with Distributed Winding
  10. Synchronous Generator Ratings and Loss Dissipation
  11. Voltage Regulation of Synchronous Generator
  12. Armature Reaction in Synchronous Generator
  13. Power Flow Equation of Synchronous Generator
  14. Parallel Operation of Synchronous Generator
  15. Short Circuit Current in Synchronous Generator
  16. Single Phase Synchronous Generator
  17. Salient Pole Synchronous Generator
  18. Synchronous Vibrator and Synchronous Chopper
  19. External Characteristics of DC Shunt Generator
  20. External Characteristics of Compound Generator